Preferred and recommended Solution
- Minimize downtime, maximize efficiency
- Detect and solve any infrastructure issue in minutes with detailed monitoring
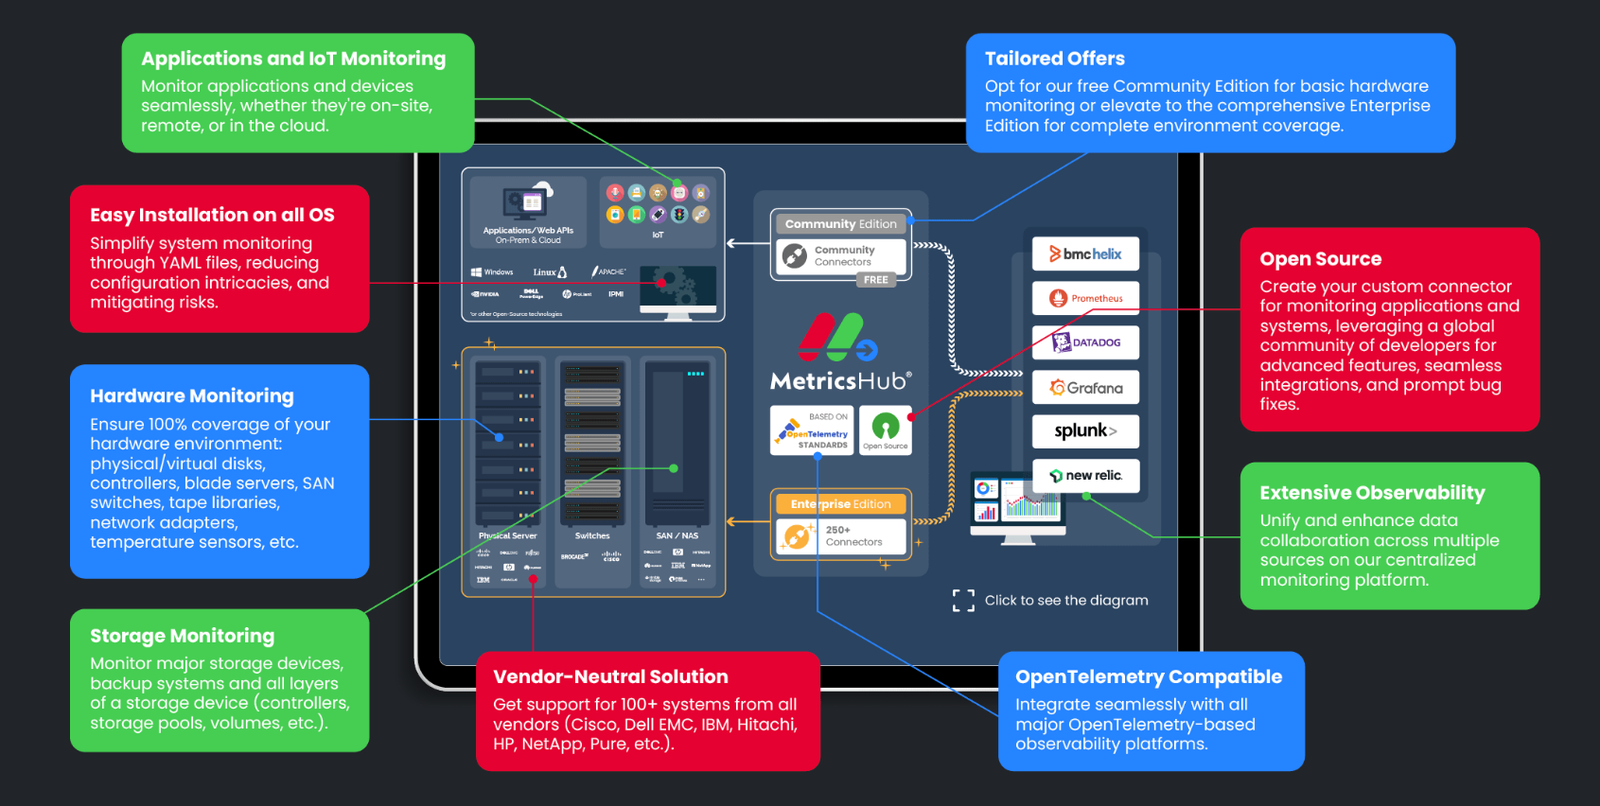
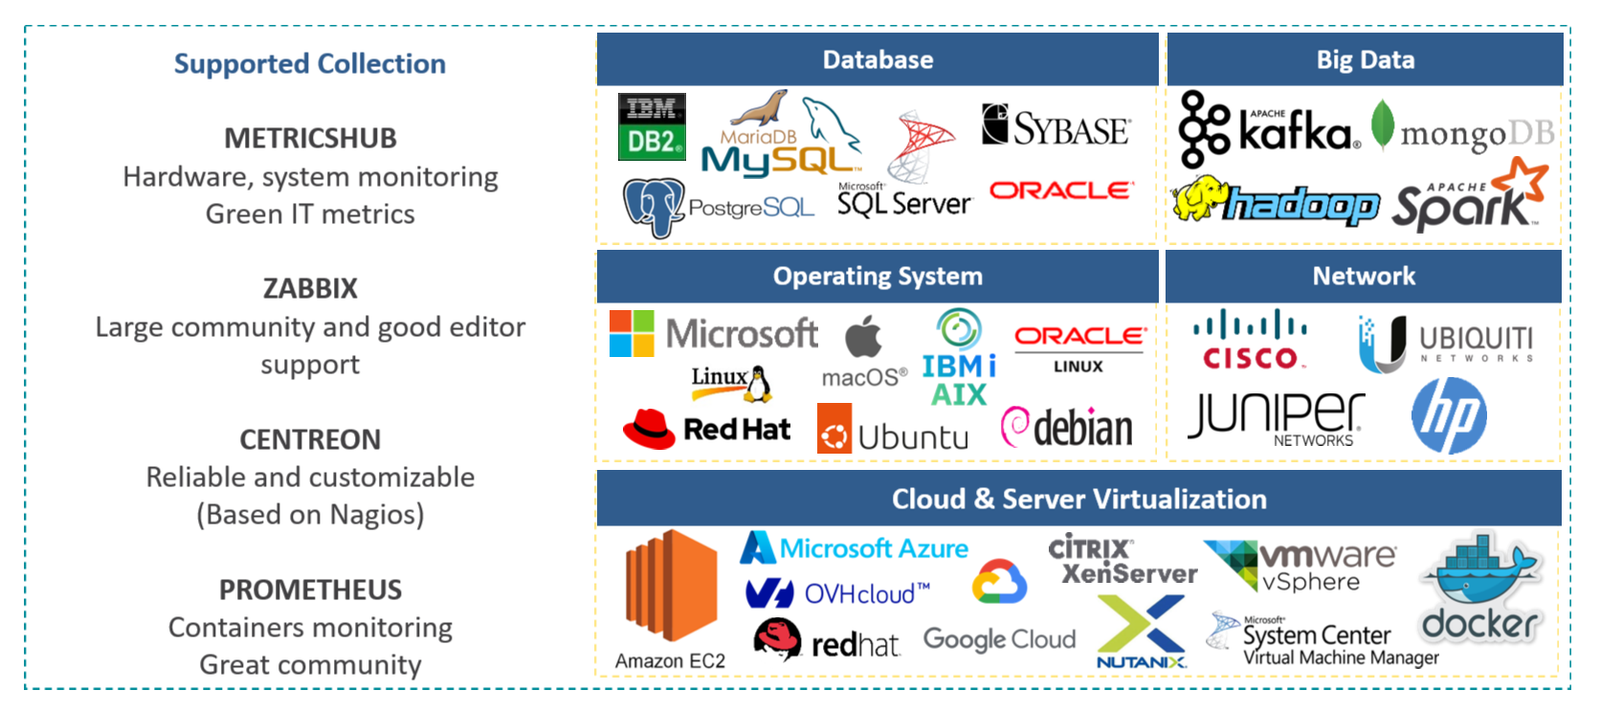
- Seamless setup to monitor servers, network devices or storage systems from any vendor with 250+ connectors
- Fast and scalable installation with a single agent to monitor hundreds of remote systems
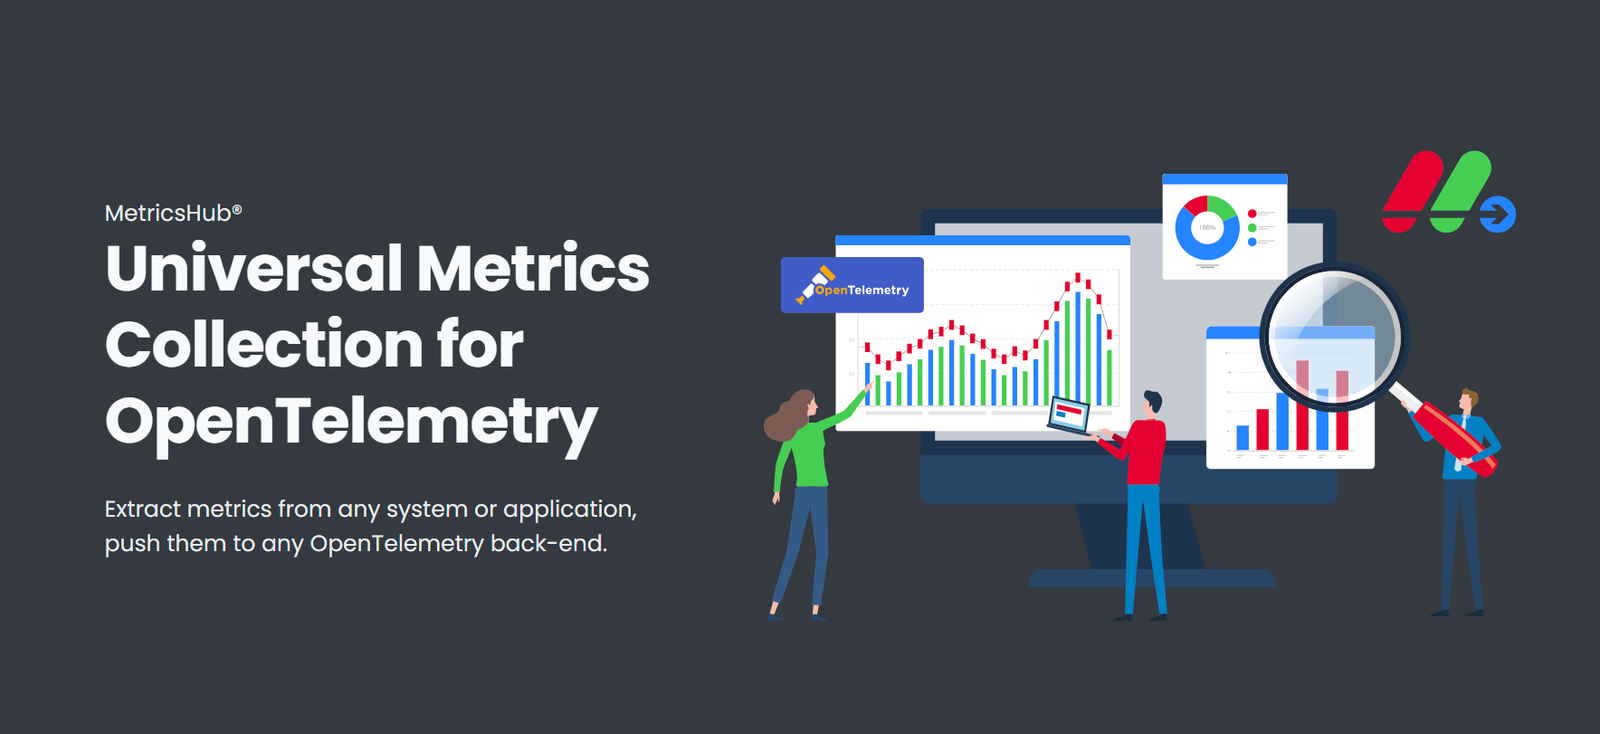
- Push standardized metrics to Prometheus and MOMA through OpenTelemetry
- Stunning out-of-the-box Grafana dashboards for system and hardware monitoring, and Green IT reports
- Simple to customize to fulfill any specific monitoring requirement, to collect custom metrics through SSH, HTTP, WBEM, SNMP, etc.
Network Monitoring
Ensure network reliability and security with MOMA IT’s network monitoring tools. Our platform provides real-time tracking and easy integration with existing network tools, so you can monitor all data sources consistently and quickly identify any issues.
- Tool Compatibility: Integrates with your existing network tools.
- Complete Network View: All network data in one place
- Quick Issue Identification: Pinpoint network problems efficiently
Systems & Applications
Gain insight into your applications and operating systems with a solution that integrates smoothly with existing monitoring tools. MOMA lets you track application performance and system health across all environments also through integrated monitoring solution : MetricsHub.
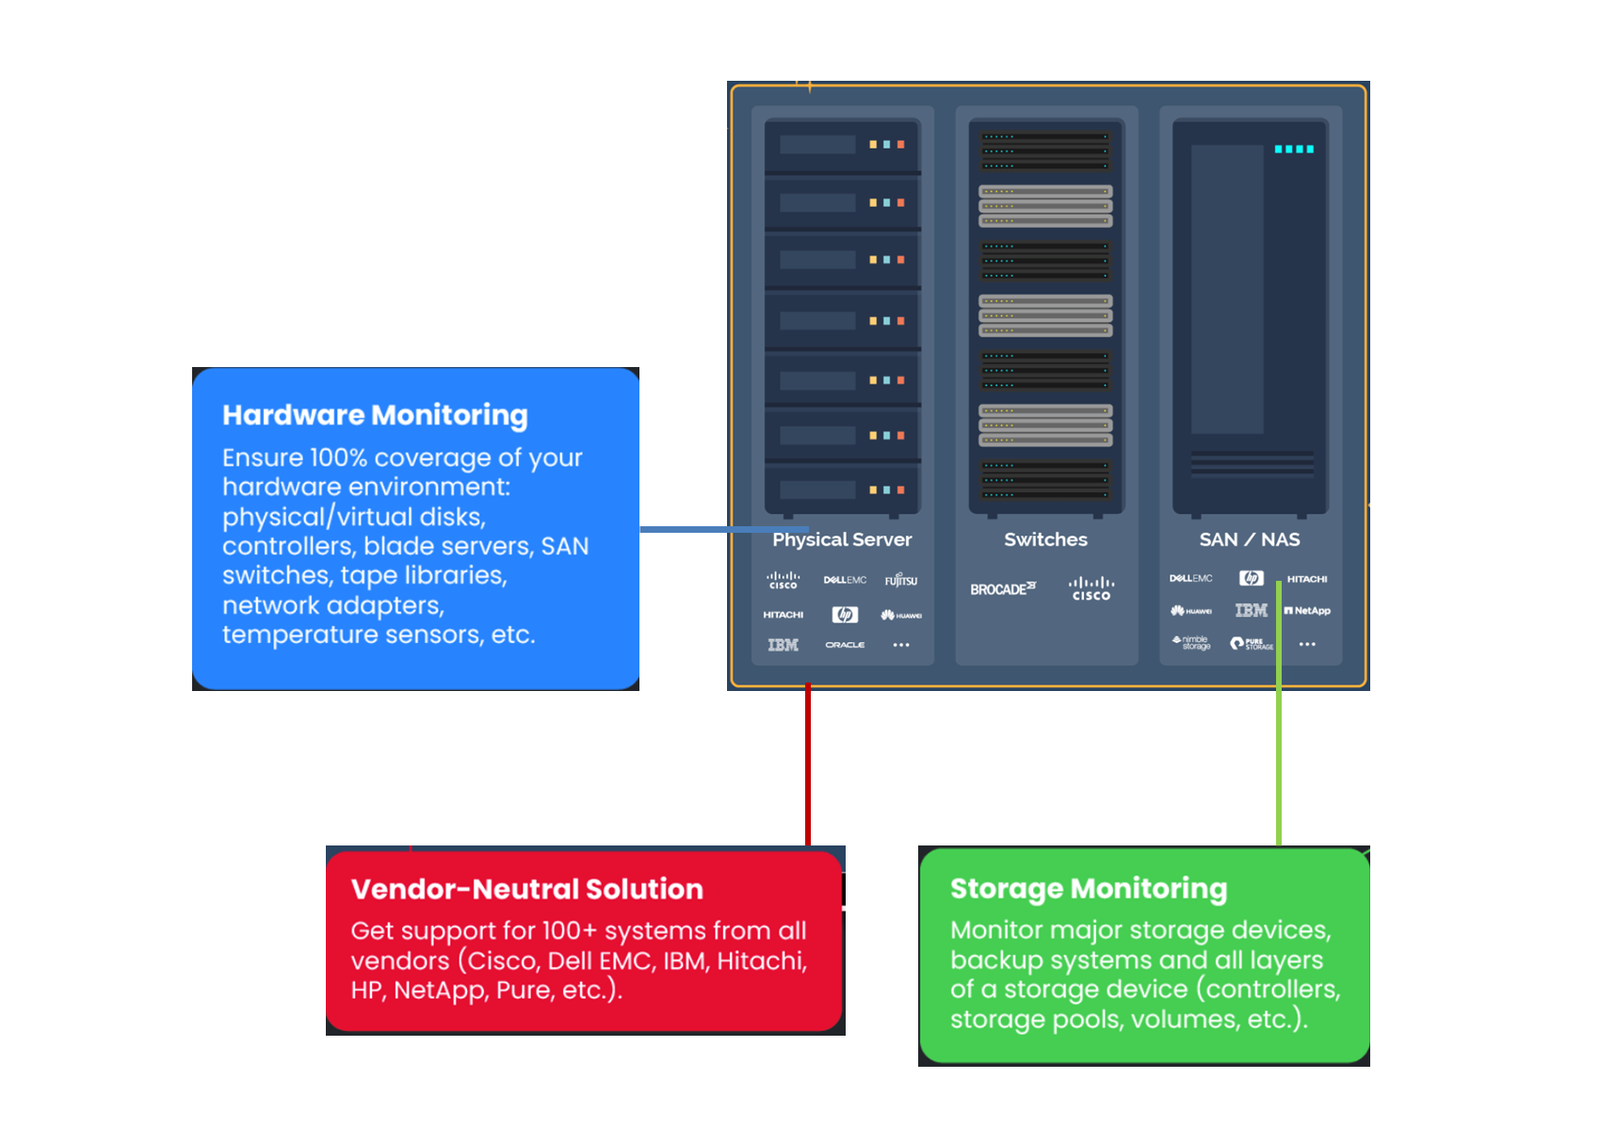
Make you hardware-independent for monitoring components (disks, controllers, CPUs, etc.)
- on servers, routers, switches, etc.
- Monitor power consumption, CO2 emissions and associated costs.
- Treat all sources in the same way and provide a single message to enable correlation with other events.
- Provide you with energy consumption reports and means of comparison with MOMA for Green IT.
Hardware & Storage
The major shift towards new technologies such as virtualization and containerization makes hardware management even more critical.
- Tool Compatibility: Integrates with your existing network tools.
- Complete Network View: All network data in one place
- Quick Issue Identification: Pinpoint network problems efficiently
IOT Monitoring
- Real-Time Device Health and performance insights.
- Unified IoT Data alongside other monitoring metrics.
- Enhanced Security to keep IoT devices protected.
User Transaction Simulation
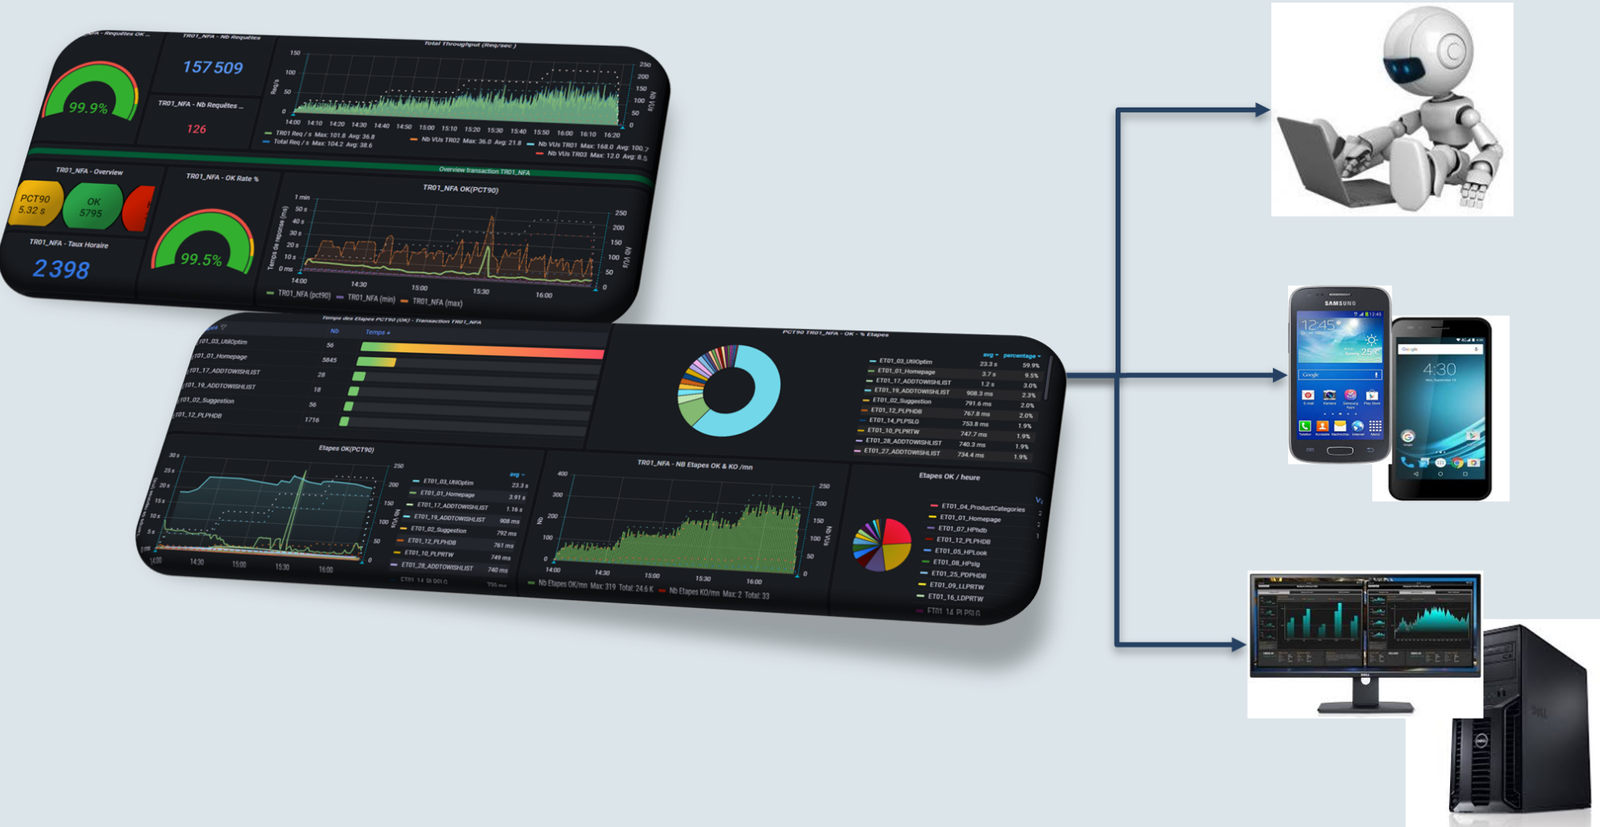
The collection of metrology data using one or more robots allows you to monitor in real time and at regular intervals the availability and performance of your applications as perceived by your users, to create a measurement benchmark to be proactively alerted to abuses and allow IT operations and production teams to restore a corrupt service as quickly as possible.
- The vision from the user point of view 24/24 and 7/7 from a specific location.
- Measuring the Quality of Service provides users in terms of availability and performance of access to your web applications and heavy clients
- Create alerts and analysis dashboards in order to quickly identify the origin of problems and provide valuable assistance in resolution.
- Allow you to move from monitoring to observability by correlating all of your metrics with performance data and log management.
Digital Experience
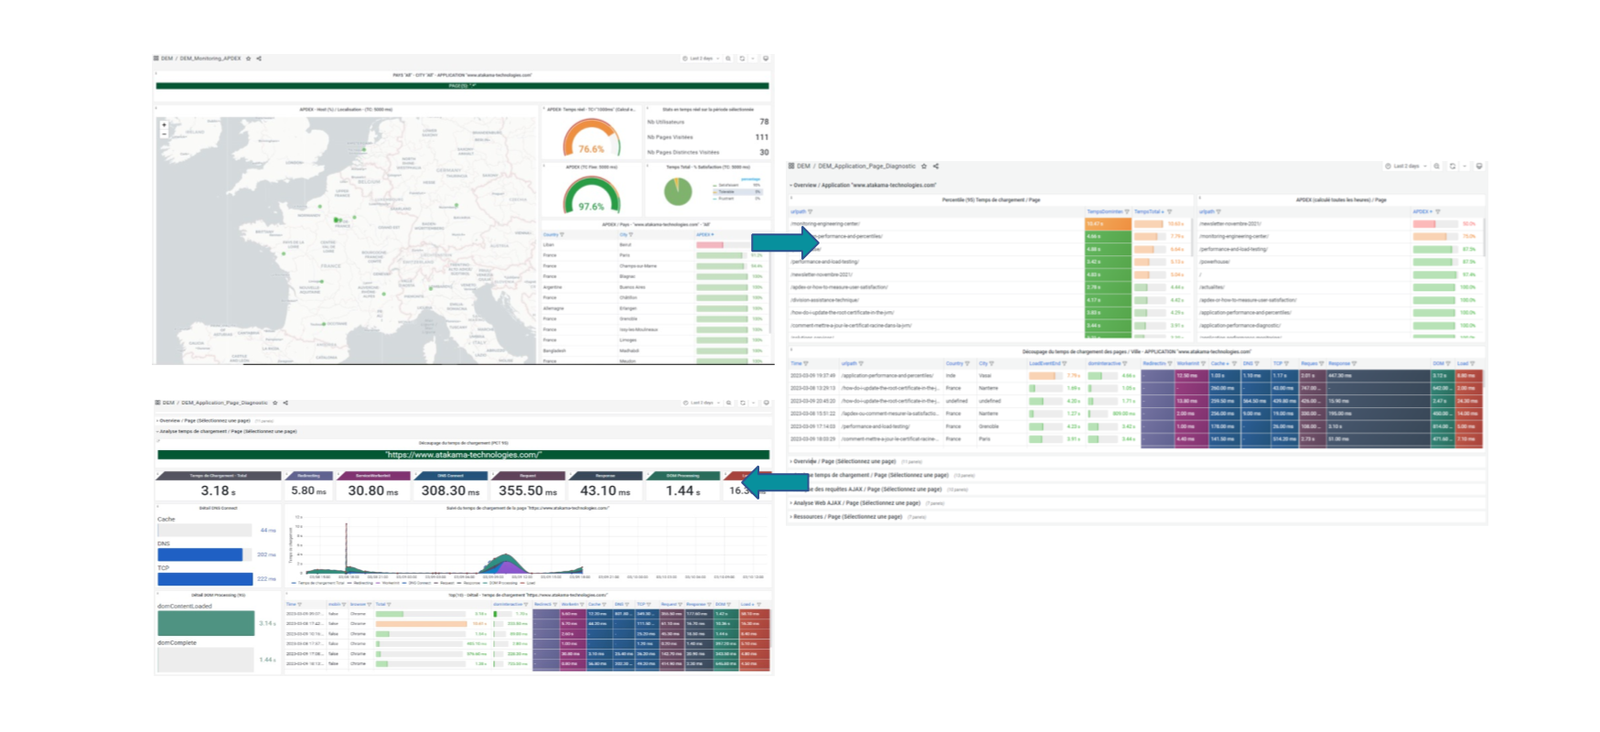
Real-time monitoring of the digital experience of real users of your web applications allows you to obtain an overview of the pages most requested by your users (or whther they are geographically), to detect slow pages , to be alerted of performance drifts, to simply diagnose and analyze the causes of these anomalies.
- Observe and understand the behavior of real users in your digital application
- Detect the slowest pages and measure the impact on your users
- Analyze and diagnose the cause of degraded response times (network, server or DOM breakdown), to facilitate corrective actions
- Notify teams of performance degradations impacting your users
